Elections
The resignation of ward councillor Glen Rowlands caused a casual vacancy in the District Council of Yankalilla, Light ward.
Section 6A of the Local Government (Elections) Act 1999 was applied to fill this vacancy.
The candidates who were not elected in the July 2024 supplementary election were asked to confirm their willingness and eligibility to be elected to this vacancy. As two candidates were determined willing and eligible to be elected to the vacancy, a recount of the votes cast at the supplementary election was conducted from 10am on Wednesday 16 October 2024 at 81-95 Waymouth Street, Adelaide.
First preference votes
First preference votes were distributed to the two eligible candidates, and ballot papers with no preference expressed for an eligible candidate were recorded as exhausted.
Below are the first preference votes received by the candidates in the order they appeared on the ballot paper.
| Candidate | First preference votes | Elected or excluded |
|---|---|---|
| DENTON, Gavin | 434 | |
| GROCKE, Shane | 517 | Elected |
| Exhausted* | 174 | |
| TOTAL | 1,125 |
Results declaration
|
|
Due to achieving the higher number of votes, Shane GROCKE was provisionally declared elected at 10.30am on Wednesday 16 October 2024. |

To view the distribution of votes refer to the District Council of Yankalilla – Light ward councillor scrutiny sheet.
* An exhausted vote is a type of preferential vote where all the ranked candidates have already been elected or eliminated. This means that the vote no longer counts towards any winning candidate. It is also known as an exhausted ballot.
Count summary
Scrutiny and count was conducted on Tuesday 26 November 2024.
| Enrolled voters | 6261 |
|---|---|
| Envelopes returned | 1455 |
| Envelopes accepted | 1415 |
| Envelopes rejected | 40 |
| Voter participation | 23.24% of the total enrolment |
| Formal votes | 1407 |
| Informal votes | 8 |
| Quota | 704 |
First preference votes
Below are the first preference votes received by the candidates in the order they appeared on the ballot paper.
| Candidate | Candidate Donations Return 1 | Candidate Donations Return 2 | First preference votes | Percent | Elected or Excluded |
| WOGHIREN, Samuel | CDR1 | CDR2 | 171 | 12.15% | Excluded |
| MARCINIAK, Christopher | CDR1 | CDR2 | 22 | 1.56% | Excluded |
| HUANG, Sunny | CDR1 | CDR2 | 102 | 7.25% | Excluded |
| SINGH, Rajinder | CDR1 | CDR2 | 24 | 1.71% | Excluded |
| YOUNG, Joe | CDR1 | CDR2 | 255 | 18.12% | |
| VLAHOS, George | CDR1 | CDR2 | 471 | 33.48% | ELECTED |
| MORFIDIS, Paul | CDR1 | CDR2 | 85 | 6.04% | Excluded |
| VERMA, Kirti | CDR1 | CDR2 | 135 | 9.59% | Excluded |
| CAIRE, Jason | CDR1 | CDR2 | 66 | 4.69% | Excluded |
| LETTON, Scott | CDR1 | CDR2 | 76 | 5.40% | Excluded |
| Total | 1,407 |
Distribution of preferences - Final result
After the distribution of preferences, George Vlahos was declared elected at 12:37pm on Tuesday 26 November 2024.
To view the distribution of votes refer to the scrutiny sheet.
Daily returns
Timetable
| Event | Legislation* | Date |
|
Close of rolls |
s 6(7)(a), s 15(9)(b) |
5 pm, Friday 30 August 2024 |
|
Nominations open |
s 19(4) |
Thursday 26 September 2024 |
|
Nominations close |
s 23(b) |
12 noon, Thursday 10 October 2024 |
|
Draw for positions on the ballot paper |
s 29(3)(b) |
2.00pm Thursday 10 October 2024 |
|
First campaign donation return due |
s 80(3)(a)(ii) | Thursday 17 October 2024 to Thursday 24 October 2024 |
|
Mailout of materials |
s 39(1) |
Tuesday 29 October 2024 to Monday 4 November 2024 |
|
Last day for re-issue of voting materials |
s 39(4), s 43(4) |
5 pm, Monday 18 November 2024 |
|
Close of voting (polling day) |
s 6(6), s 6(7)(b) |
12 noon, Monday 25 November 2024 |
|
Scrutiny and count |
s 47(1)(a) |
Tuesday 26 November 2024 (tentative) |
| Second campaign donation return due | s 80(3)(b) |
Within 30 days of the 'conclusion of the election' |
Count summary
Scrutiny and count was conducted on Tuesday 26 November 2024.
| Enrolled voters | 2082 |
|---|---|
| Envelopes returned | 917 |
| Envelopes accepted | 895 |
| Envelopes rejected | 22 |
| Voter participation | 44.04% of the total enrolment |
| Formal votes | 884 |
| Informal votes | 11 |
| Quota | 295 |
First preference votes
Below are the first preference votes received by the candidates in the order they appeared on the ballot paper.
| Candidate | Candidate Donations Return 1 | Candidate Donations Return 2 | First preference votes | Percent | Elected or Excluded |
| SCHKABARYN, Tony | 61 | 6.9% | |||
| LOCKE, Rob | CDR1 | CDR2 | 104 | 11.76% | |
| TOD, Sophie | CDR1 | CDR2 | 452 | 51.13% | Elected 1 |
| DOULT, Timothy | CDR1 | CDR2 | 46 | 5.2% | |
| EASON, Jo-Anne | CDR1 | CDR2 | 221 | 25% | Elected 2 |
| Total | 884 |
Distribution of preferences - Final result
After the distribution of preferences, Sophie Tod and Jo-Anne Eason were provisionally declared elected at 3:26pm, Tuesday 26 November 2024.
To view the distribution of votes refer to the scrutiny sheet.
Daily returns
Timetable
| Event | Legislation* | Date |
|
Close of rolls |
s 6(7)(a), s 15(9)(b) |
5 pm, Friday 30 August 2024 |
|
Nominations open |
s 19(4) |
Thursday 26 September 2024 |
|
Nominations close |
s 23(b) |
12 noon, Thursday 10 October 2024 |
|
Draw for positions on the ballot paper |
s 29(3)(b) |
2.00pm Thursday 10 October 2024 |
|
First campaign donation return due |
s 80(3)(a)(ii) | Thursday 17 October 2024 to Thursday 24 October 2024 |
|
Mailout of materials |
s 39(1) |
Tuesday 29 October 2024 to Monday 4 November 2024 |
|
Last day for re-issue of voting materials |
s 39(4), s 43(4) |
5 pm, Monday 18 November 2024 |
|
Close of voting (polling day) |
s 6(6), s 6(7)(b) |
12 noon, Monday 25 November 2024 |
|
Scrutiny and count |
s 47(1)(a) |
Tuesday 26 November 2024 (tentative) |
| Second campaign donation return due | s 80(3)(b) |
Within 30 days of the 'conclusion of the election' |
Count summary
Scrutiny and count was conducted on Tuesday 17 December 2024.
| Enrolled voters | 1,663 |
|---|---|
| Envelopes returned | 591 |
| Envelopes accepted | 585 |
| Envelopes rejected | 6 |
| Voter participation | 35.54% of the total enrolment |
| Formal votes | 584 |
| Informal votes | 1 |
| Quota | 293 |
First preference votes
Below are the first preference votes received by the candidates in the order they appeared on the ballot paper.
| Candidate | Campaign Donations Returns 1 | Campaign Donations Returns 2 | First preference votes | Percent | Elected or Excluded |
| LUKACS, Angela | CDR1 | CDR2 | 183 | 31.3% | Excluded |
| GAMERTSFELDER, Jakob | CDR1 | CDR2 | 193 | 33.0% | |
| MYERS, Kevin Paul | CDR1 | CDR2 | 208 | 35.6% | Elected |
| Total | 584 |
Distribution of preferences - Final result
After the distribution of preferences, Kevin Paul Myers was declared elected at 10:32am on Tuesday 17 December 2024.
To view the distribution of votes refer to the scrutiny sheet.
List of candidates
In accordance with the Local Government (Elections) Act 1999, the draw to determine the order of candidate names to appear on the ballot paper was held on Thursday 31 October 2024. The result of the draw are detailed below.
LUKACS, Angela
I live with my husband and three boys; the youngest is just finishing high school. I am a primary school teacher of nearly 30 years, and a swimming teacher of more than 10 years. I started my first aid training business in 2015 which keeps me busy. I have a Bachelor of Teaching/Bachelor of Arts and a Certificate IV in Training and Assessment. I have been the Regional Liaison Officer for Royal Life Saving SA since 2010, and run their local Holiday Swim programs, teaching all ages swimming and water safety skills. I volunteer with the local army cadet unit and at the local library. Through my business, I happily share my knowledge with various community groups. I have been Chairperson for the Riverland West Chamber of Commerce since 2022. I initiated the RWCC Career Expo and Business Awards in 2021. With a strong sense of community, I will ensure the whole region is treated equitably and people are encouraged to the district for business, employment, and lifestyle.
I live in Eyre Ward
Contact Details: riverlandtrainer @gmail.com
I am not a member of a Political Party
GAMERTSFELDER, Jakob
My work focuses on helping people stay in our area, to stay in their own homes. My volunteer work is the organisation of meal deliveries. My paid work is helping people deal with organisations that provide healthcare, home care and transport. In the twelve years I have lived in Morgan I have been very public about helping our area grow. I am always happy to write, talk or act on things which improve living in our area. I have a very simple focus; for every group I work with I want to achieve goals and be financially successful. Which is why I want to run for council. My emphasis on our future is creating more housing in our area. Our local council can do that, and by providing more housing options, help Australia, and help local ratepayers' finances. I love living in Morgan, they've been the best years of my life, I want other people to feel what I feel. Vote for me if you want that too. Jakob Gamertsfelder 0455 382 366 jakobgamertsfelder @gmail.com instagram.com @jakobgamertsfelder
I live in Eyre Ward
Contact Details: jakobgamertsfelder @gmail.com
I am not a member of a Political Party
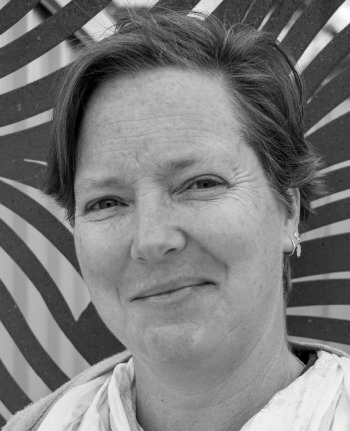
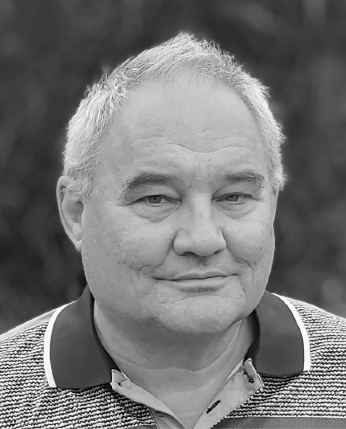
MYERS, Kevin Paul
After serving 16 years as an elected member of Mid Murray Council’s Eyre Ward, I have had a 2-year break but am now ready to return and represent the rate payers if elected. I am currently still involved as Chair of the Heritage and Maritime Board, but feel I have a lot more to offer the residents of Eyre Ward and the wider Council area. I have a broad knowledge of how Council works in the areas of Planning, Infrastructure and Finance. My experience in chairing many of Councils section 41 committees has helped build my knowledge of all Mid Murray towns and the issues they face. More support is needed for our youth, elderly and disabled who reside in the rural areas of our Council. In the past I have been a Council representative on Truro, Blanchetown, Cadell and Morgan Community organizations and I believe the strength of a Council comes from the smaller regional towns. I will push for further support in the areas of flood clean up in river towns and more upgrades for our regional road.
I live in Eyre Ward
Contact Details: kpmyers8 @bigpond.com
I am not a member of a Political Party
Daily returns
Timetable
| Event | Legislation* | Date |
|
Close of rolls |
s 6(7)(a), s 15(9)(b) |
5 pm, Monday 30 September 2024 |
|
Nominations open |
s 19(4) |
Thursday 17 October 2024 |
|
Nominations close |
s 23(b) |
12 noon, Thursday 31 October 2024 |
|
Draw for positions on the ballot paper |
s 29(3)(b) |
2.00pm Thursday 31 October 2024 |
|
First campaign donation return due |
s 80(3)(a)(ii) | Thursday 7 November 2024 to Thursday 14 November 2024 |
|
Mailout of materials |
s 39(1) |
Tuesday 19 November 2024 to Monday 25 November 2024 |
|
Last day for re-issue of voting materials |
s 39(4), s 43(4) |
5 pm, Monday 9 December 2024 |
|
Close of voting (polling day) |
s 6(6), s 6(7)(b) |
12 noon, Monday 16 December 2024 |
|
Scrutiny and count |
s 47(1)(a) |
Tuesday 17 December 2024 |
| Second campaign donation return due | s 80(3)(b) |
Within 30 days of the 'conclusion of the election' |