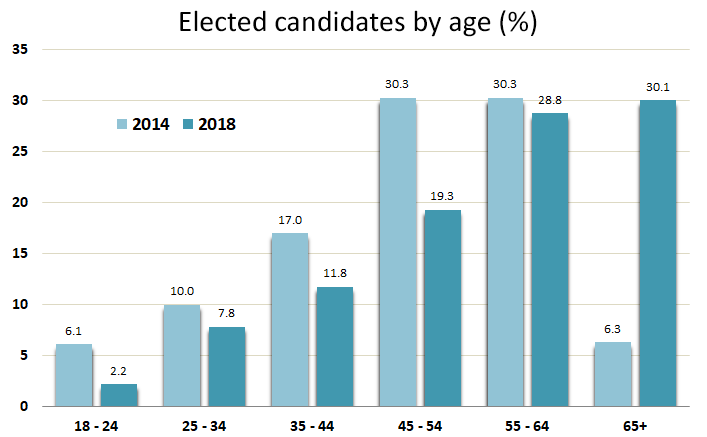
- Elected candidates by age
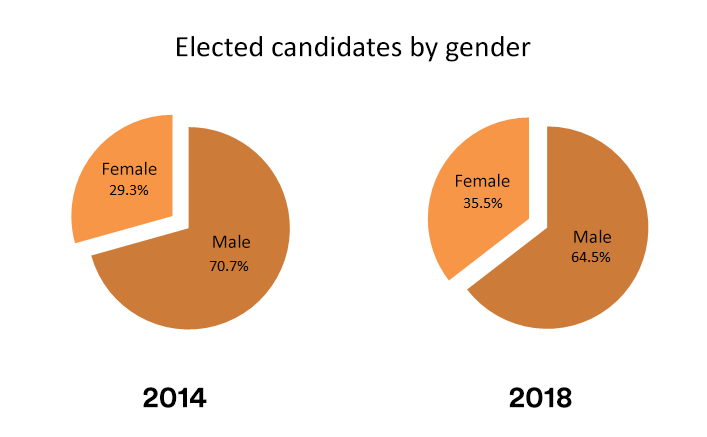
- Elected candidates by gender
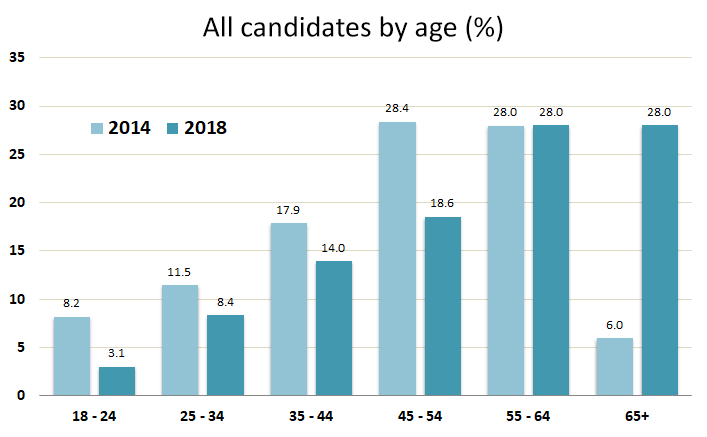
- All candidates by age
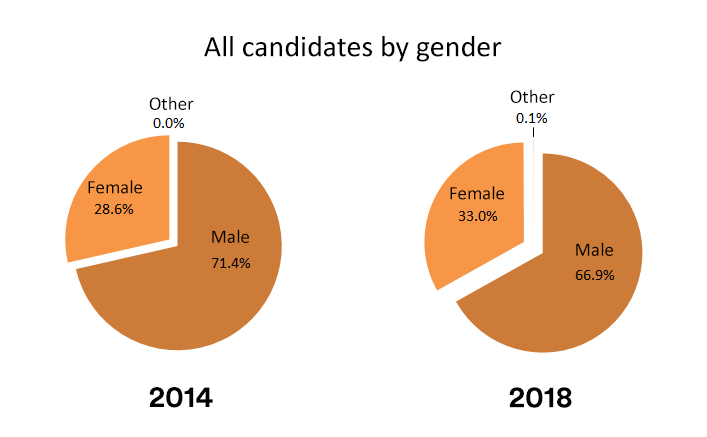
- All candidates by gender
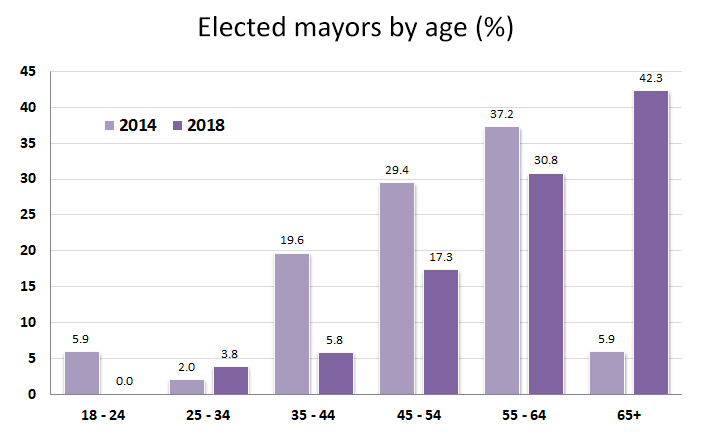
- Elected mayors by age
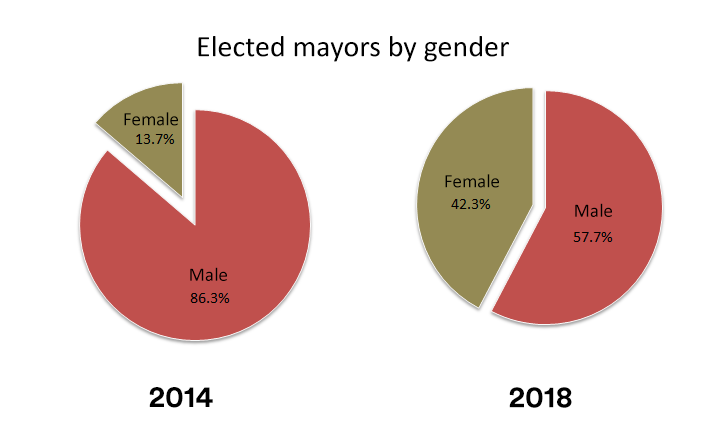
- Elected mayors by gender
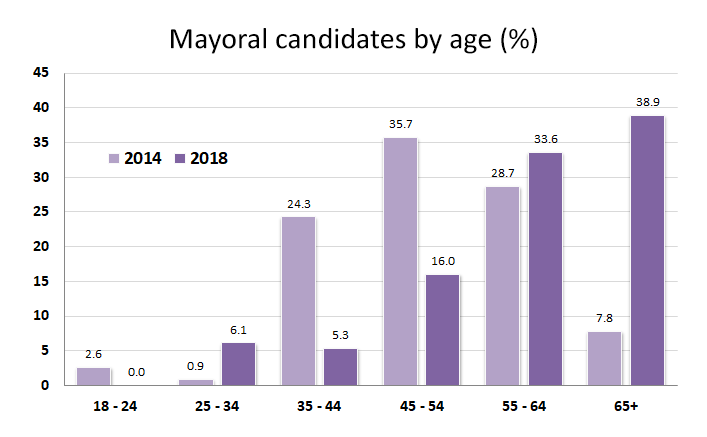
- Mayoral candidates by age
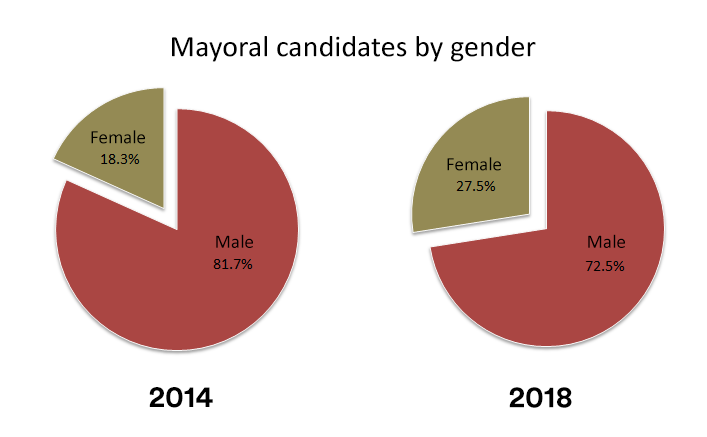
- Mayoral candidates by gender
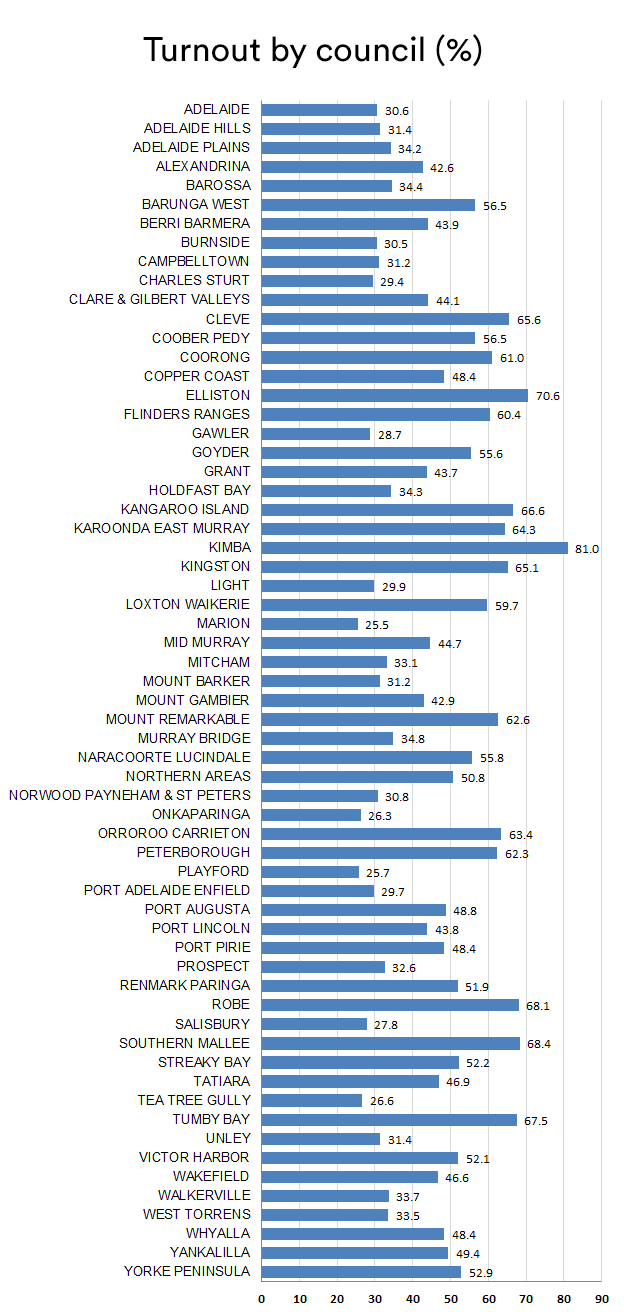
- Turnout by council
- Daily returns
Daily returns compared to 2014 council elections
| Received | Roll Total | Percentage | |
| SA total | 398215 | 1,208,858 | 32.94% |
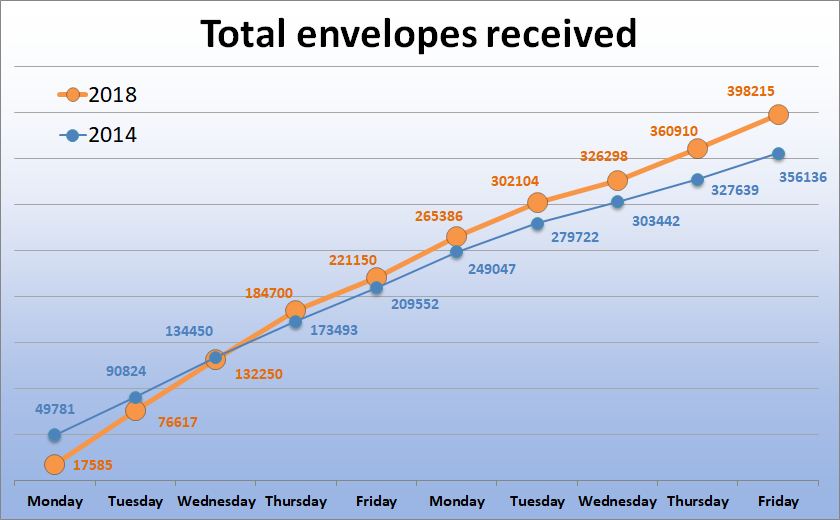
Note : these figures represent the total numbers of all declarations envelopes received and processed.