Chapter 7 - Election costs
The actual expenditure incurred for the conduct of the election is estimated at $27.432 million for the period to June 2023.
Most of the cost ($26.423 million) was spent in the 2021–22 financial year. Preliminary expenditure of $460,000 in 2020–21 is related to the implementation of the online employment portal, training materials and implementation of the learning management system, project management, and facility preparation. A further $549,000 was spent on post-election activities in 2022–23, primarily on non-voter communications and follow-up and the receipt, sorting, storage, and disposal of election materials.
In Chapter 7 - Election costs...
Comparison with budget
The budget allocation from the Department of Treasury and Finance (Treasury) for the state election was $22.926 million in total, represented by $778,000 in 2020–21 for preliminary activities, $21.759 million in 2021–22, and $389,000 in 2022–23 for post-election activities. This allocation was determined based on the same activities and volumes as the 2018 election, plus inflationary growth in costs and increases in volumes over the 4 years between elections, expected changes in conditions (such as more demand for early voting options), and modernisation improvements approved by the government.
Further budget allocations totalling $2.346 million were provided by Treasury during the 2021–22 financial year for the impacts of the COVID-19 pandemic on the conduct of the election.
The total budget allocation from Treasury amounted to $25.272 million.
Total actual expenditure was $2.160 million greater than the total budget allocation, primarily due to:
It is not possible to determine the extent to which the additional hours worked and other costs were caused by the COVID-19 conditions or other factors, such as the changes in early voting volumes and timing of attendance at polling booths.
These additional costs were partly offset by lower mobile polling costs due to the cancellation of electoral visitors to declared institutions such as nursing homes.
The adverse variation was funded by agency cash reserves.
ECSA also received an investing expenditure allocation from Treasury of $3.115 million for state election-related capital expenditure projects, predominantly the creation of EMO. This replaced paper electoral rolls, although paper rolls were still available in all polling booths as a backup.
Total project expenditure is estimated at $3.205 million for the period to June 2023, which is $90,000 more than the budget allocation. The additional expenditure is mainly due to purchasing extra laptops to ensure coverage at all polling locations.
Comparison with 2018 State Election costs
The total actual expenditure of $27.432 million for the election compares with $16.728 million for the 2018 election.
The increase of $10.704 million relates to:
Unavoidable cost pressures:
Changes in conditions:
The COVID-19 pandemic was the single largest change in conditions from the 2018 election. Other changes include:
There were 1,266,719 electors on the roll for the state election compared with 1,201,775 for the 2018 election – an increase of 64,944 electors or 5.4%.
Cost per elector
Cost per elector has risen to $21.66 from $13.92 in 2018. The increase is due to unavoidable cost pressures and changes in conditions over the 4 years between elections. The cost per elector reduces to $19.41 after excluding direct COVID-19 costs.
FAST FACT |

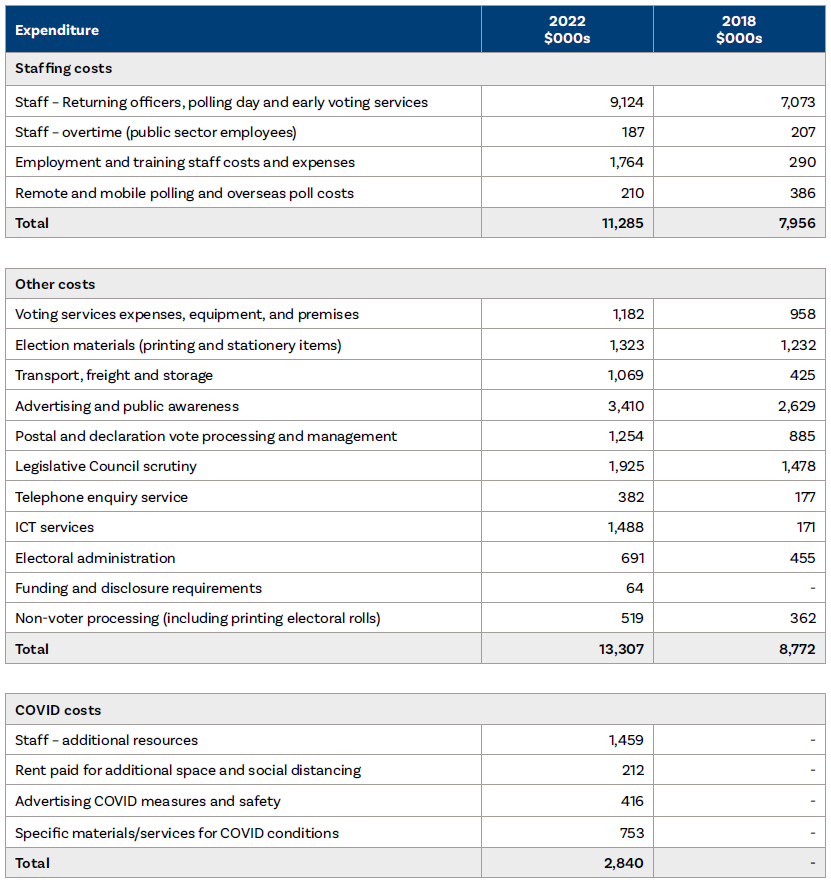
Comparison of costs for the 2022 and 2018 state elections:
Disclaimer
Copyright © Electoral Commission of South Australia. Published 2023. All rights reserved.
No part of this report may be reproduced by any process, except in accordance with the Copyright Act 1968
Printed copies of this document are available from: Electoral Commission of South Australia
Level 6 / 60 Light Square, Adelaide SA 5000.
Phone: 61 8 7424 7400